Solar Irrigation Information System
Acknowledgement & Team
Create Query
Variable & Temporal resolution
×
Variable
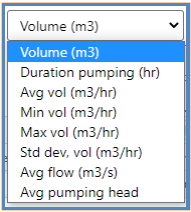
Interested analyzing variable (parameter) can be selected in the top dropdown box of the section. Output data and graphs are generated based on this selection.

Temporal resolution
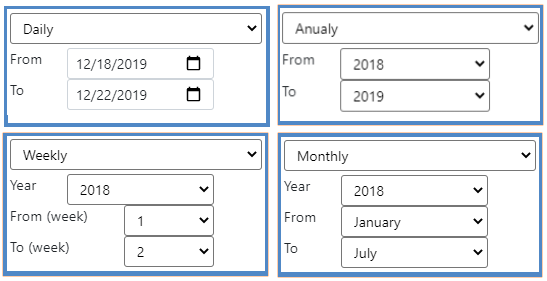
Input for time series is taken in this section. Daily, weekly, monthly and annually parameters are given as query inputs for the calculations.

Area & pump cluster
Area selection
×
Calculations are done based on area selection. Kenyan district and zone admin areas are availble for filtering. In case of none selection of district or zone entire country (Kenya) is picked as default input boundary.

Pump cluster
×
Low pump utilization & Low average weekly volume
Lower pump utilization & Higher average weekly volume
Higher pump utilization & Lower average weekly volume
High pump utilization & High average weekly volume
Description about other

This is the explanation of that area. User can select his area of interrest. This is the explanation of that area. User can select his area of interrest.

 
Query results
Query Results
×
Query results are calculated as per the query inputs provided. Results can be added to three different tabs for comparisons on different query inputs. A graphical output is generated and displayed for each query provided by the user.

Result Form 2021-04-23   To   2021-04-23
Date Pump Cluster Volume (m3) Duration pumping (hr) Avg vol (m3/hr) Min vol (m3/hr) Max vol (m3/hr) Std dev, vol (m3/hr) Avg flow (m3/s)
2020-05-17 8.5 4 5.65 1 9.5 5.65 1 9.5 5.65
2020-05-18 7.7 4 8.00 2 9.5 5.65 1 9.5 5.65
2020-05-19 3.4 4 9.4 3 9.5 5.65 1 9.5 5.65
2020-05-20 11.00 4 7.22 4 9.5 5.65 1 9.5 5.65
2020-05-21 13.43 4 21.2 5 9.5 5.65 1 9.5 5.65
2020-05-22 10 4 15 6 9.5 5.65 1 9.5 5.65
Intro Popup

Solar Irrigation Information System is a prototype platform that uses near real time data from solar powered irrigation pumps manufactured by Future Pump and located in Kenya. The data derived from individual pumps gives information on location, pumps activity (on/off).

From this basic data it is possible to aggregate data to firstly work out different patterns of use. This helps future design, needs and operations of pumps to support and design teams. The data also provides information on rates of abstraction of shallow groundwaters which ultimately work out when and how much water is being abstracted and if this is sustainable or how it could be better managed in relation to rainfall recharge (this will be the focus of subsequent developments).

The prototype presented here gives access to hourly or aggregated data displayed by different user patterns (as identified through using the raw data with machine learning algorithms. Please enjoy an exploration of the data and please send us constructive feedback to help us further improve, modify and enhance the work as we move into the next development stage.

Contact us:

Feedback
Acknowledgement and Team
Acknowledgement

This work was supported from the CGIAR Big Data Platform through the Inspire challenge, 2019 as a potential for developing a prototype communication tool using Big Data. We are also very grateful for the additional financial and in kind support from Water Land and Ecosystems , IWMI and Future Pump

Behaviour

Pump Volume Data

  • Volume
  • Charts

No data to preview