This page presents the initial results of irrigated area mapping of Asia and Africa. Unlike the previous Global Irrigated Area Map of 2000 (GIAM 2000), the focus of this study is restricted to Asia and Africa, which are highly populated and cultivated regions, but at the same time, the most data poor parts of the world. The study aimed to map the irrigated and rainfed areas of Asia and Africa using the freely available remotely sensed data. This product updates the previous estimates of irrigated areas by using the MODIS satellite data. The usage of relatively higher resolution images and classification methods based on the seasonal profile of vegetation, significantly improves the results.
The natural vegetation and croplands exhibit different patterns of seasonal changes. A procedure was developed to utilize the seasonal variations captured in multi-seasonal satellite images to classify the landscape and identifying the irrigated croplands. The mapping was done using 16-day MODIS 250m NDVI composites images (MOD13Q1). A hierarchical classification procedure involving classification techniques and time-series analysis of the NDVI data was followed. Initially, an unsupervised classification using ISODATA algorithm was performed and subsequently, the seasonal patterns of NDVI for each output cluster was analyzed to differentiate various land cover types.
The developed methodology based on the phenological changes in agriculture areas to map the irrigated and rainfed areas. An image time series created using the MOD13Q1 product of MODIS at 250m spatial resolution has been used to map the phenological stages of crops using advance image processing techniques such as Fourier and Wavelet transformation Analysis of NDVI. The analysis focus was on the quantity of green biomass, annual and semi-annual cycles of vegetation change, and its dependence on the annual rainfall cycle using Canonical Correlation Analysis (CCA) and time lagged regression to separate irrigated and rainfed areas etc.
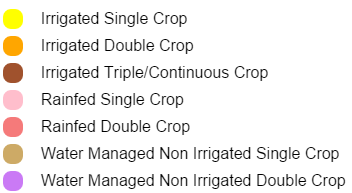
The agricultural areas were then further categorized into irrigated and rainfed by analyzing the seasonal vegetation trends. Agricultural areas with multiple cropping cycles were identified by analyzing the cyclic nature of vegetation change in agricultural systems. Based on the cropping intensity, agriculture areas were categorized into single, double and continuous crops.
For further details please contact: